

RESULTADOS DEL DÍA AL 10 DE AGOSTO DEL 2021
| ACCIONES MAS ACTIVAS | ||||||
| Name | Last | Prev. | High | Low | Chg. % | Vol. |
| Apple | 145,6 | 146,09 | 147,71 | 145,3 | -0,0034 | 68.99M |
| Microsoft | 286,44 | 288,33 | 289,25 | 285,2 | -0,0066 | 18.61M |
| Intel | 53,94 | 54,05 | 54,38 | 53,51 | -0,002 | 16.21M |
| Walmart | 148,68 | 145,58 | 148,95 | 146,25 | 0,0213 | 12.75M |
| Verizon | 55,48 | 55,12 | 55,53 | 55 | 0,0065 | 11.75M |
| PRINCIPALES GANADORES | ||||||
| Name | Last | Chg. | Chg. % | |||
| Caterpillar | 214,07 | 5,18 | 0,0248 | |||
| Walmart | 148,68 | 3,1 | 0,0213 | |||
| Dow | 63,12 | 1,3 | 0,021 | |||
| Walgreens Boots | 48,43 | 0,99 | 0,0209 | |||
| Goldman Sachs | 407,97 | 8,09 | 0,0202 | |||
| PRINCIPALES PERDEDORES | ||||||
| Name | Last | Chg. | Chg. % | |||
| Salesforce.com | 243,39 | -5,93 | -0,0238 | |||
| Visa A | 238,07 | -1,93 | -0,008 | |||
| American Express | 169,49 | -1,29 | -0,0076 | |||
| Microsoft | 286,44 | -1,89 | -0,0066 | |||
| McDonald’s | 233,45 | -1,23 | -0,0052 | |||
| PRINCIPALES INDICADORES | ||||||
| Name | Last | Chg. | Chg. % | Adv. | Dec. | |
| Dow Jones | 35265 | 162,82 | 0,0046 | 22 | 8 | |
| S&P 500 | 4436,8 | 4,4 | 0,001 | 325 | 163 | |
| Nasdaq 100 | 15054 | -79,53 | -0,0053 | 40 | 61 | |
| DAX | 15771 | 25,3 | 0,0016 | 18 | 10 | |
| FTSE 100 | 7161 | 28,74 | 0,004 | 66 | 31 | |
| Nikkei 225 | 27888 | 68,11 | 0,0024 | 111 | 102 |
Tendencias del S&P500
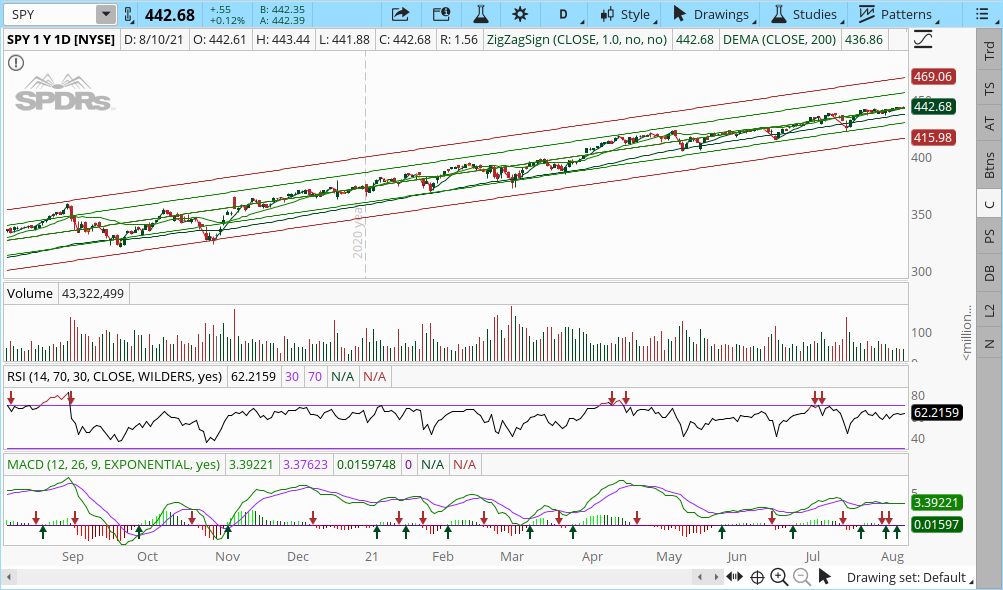
Gentileza de TD Ameritrade


