

RESULTADOS DEL DÍA AL 07 DE JULIO DEL 2021
| ACCIONES MAS ACTIVAS | ||||||
| Name | Last | Prev. | High | Low | Chg. % | Vol. |
| Apple | 144,57 | 142,02 | 144,89 | 142,66 | 0,018 | 104.91M |
| Microsoft | 279,93 | 277,66 | 280,69 | 277,15 | 0,0082 | 23.26M |
| Intel | 55,96 | 56,09 | 56,45 | 55,71 | -0,0023 | 14.86M |
| Cisco | 53,26 | 52,98 | 53,3 | 52,67 | 0,0053 | 14.41M |
| Verizon | 56,53 | 56,41 | 56,58 | 56,21 | 0,0021 | 14.39M |
| PRINCIPALES GANADORES | ||||||
| Name | Last | Chg. | Chg. % | |||
| Apple | 144,57 | 2,55 | 0,018 | |||
| 3M | 199,86 | 2,97 | 0,0151 | |||
| Home Depot | 323,48 | 4,22 | 0,0132 | |||
| Honeywell | 220,74 | 2,18 | 0,01 | |||
| Travelers | 152,19 | 1,35 | 0,009 | |||
| PRINCIPALES PERDEDORES | ||||||
| Name | Last | Chg. | Chg. % | |||
| Boeing | 231,78 | -4,36 | -0,0185 | |||
| Chevron | 102,93 | -1,06 | -0,0102 | |||
| Salesforce.com | 248,44 | -1,81 | -0,0072 | |||
| Goldman Sachs | 367,67 | -2,19 | -0,0059 | |||
| Walt Disney | 172,82 | -0,87 | -0,005 | |||
| PRINCIPALES INDICADORES | ||||||
| Name | Last | Chg. | Chg. % | Adv. | Dec. | |
| Dow Jones | 34682 | 104,42 | 0,003 | 21 | 9 | |
| S&P 500 | 4358,2 | 14,66 | 0,0034 | 318 | 174 | |
| Nasdaq 100 | 14811 | 24,18 | 0,0016 | 56 | 46 | |
| DAX | 15693 | 181,33 | 0,0117 | 24 | 6 | |
| FTSE 100 | 7151 | 50,14 | 0,0071 | 80 | 19 | |
| Nikkei 225 | 28301 | -65,95 | -0,0023 | 92 | 107 |
Tendencias del S&P500
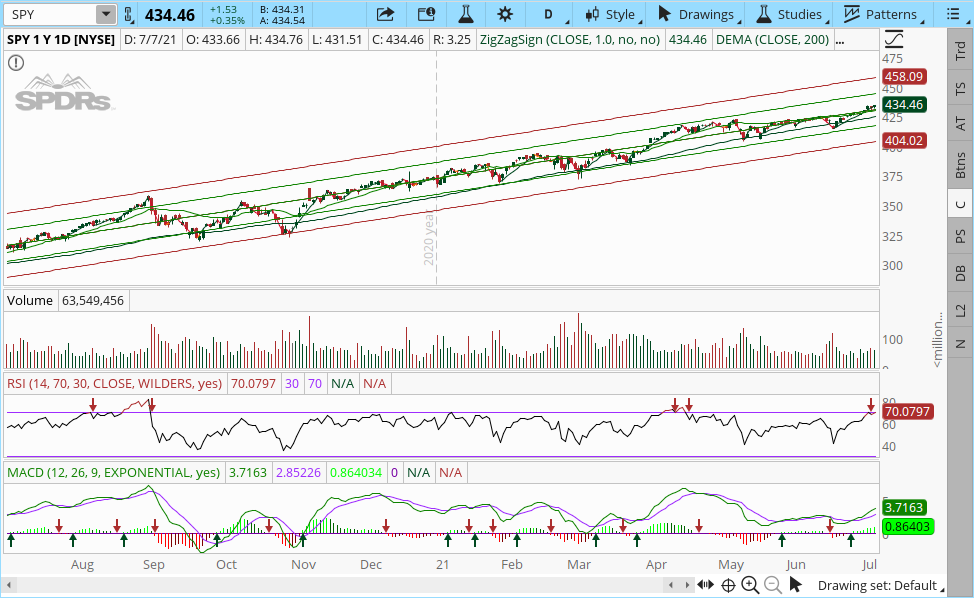
Gentileza de TD Ameritrade


